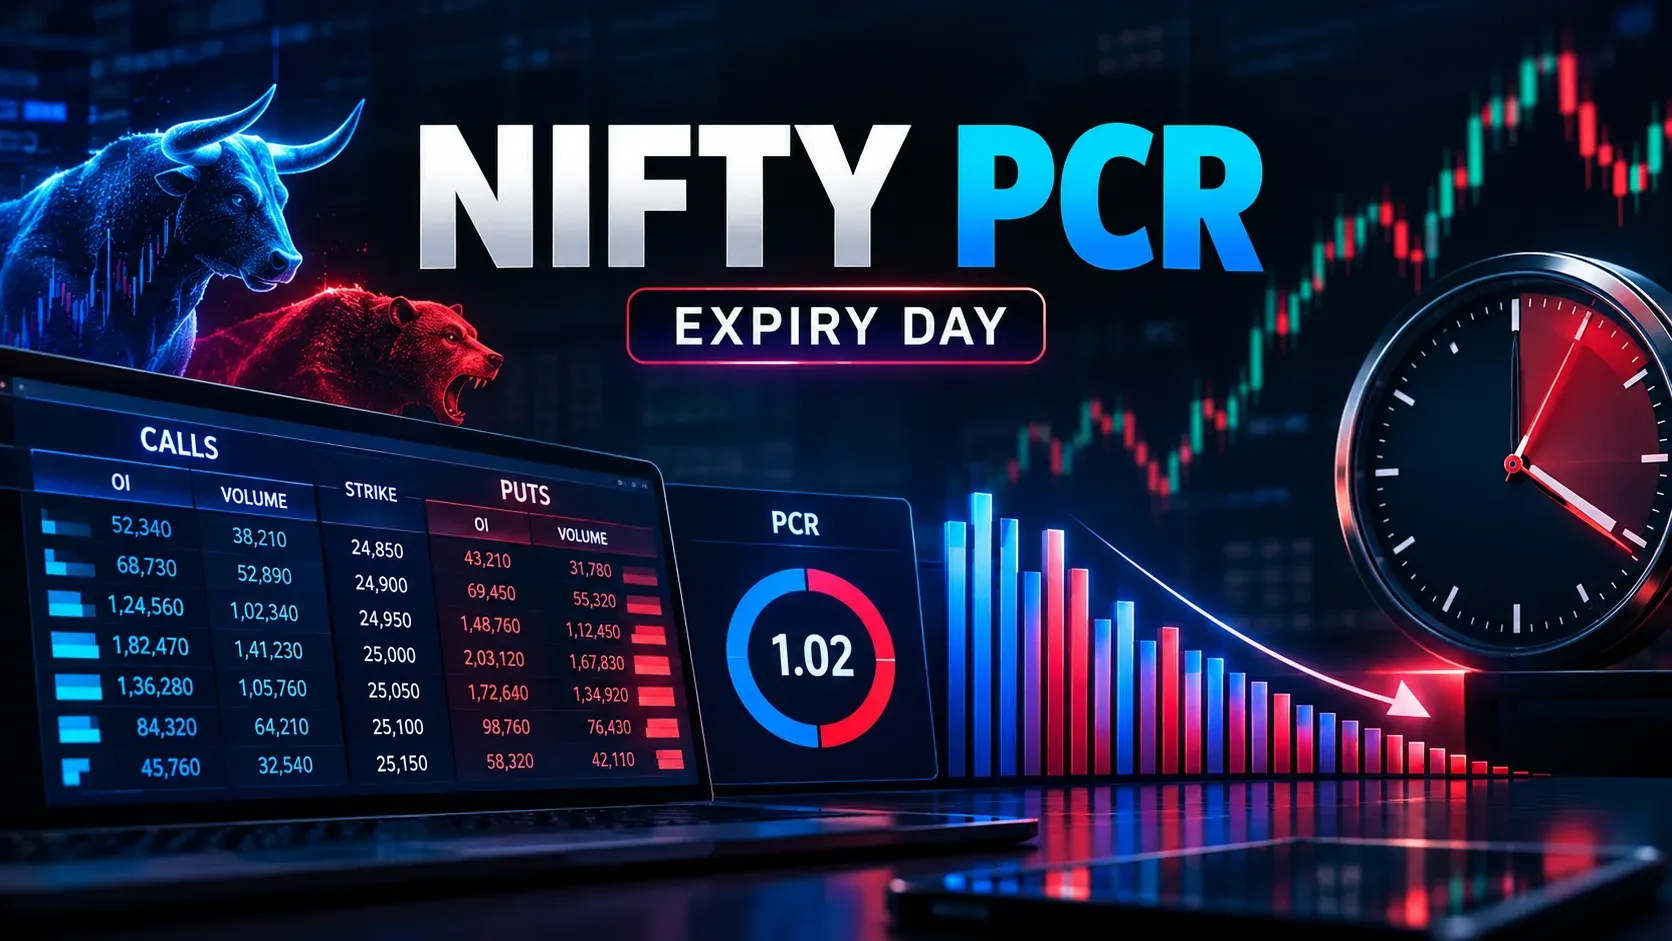
Open five broker apps before the 09:15 bell and you will see five different PCR numbers next to NIFTY. None of them are wrong. They measure different things. They update on different clocks. And — this is the part nobody tells you — they collapse toward meaningless territory in the last 45 minutes of expiry day, exactly when traders lean on them hardest.
We have traded NIFTY and SENSEX expiry-day option selling since 2006 out of our Delhi desk. PCR has been on our screens the entire time. It took us several years of logging it against the next session's move before we stopped trusting the 0.7-and-1.3 rulebook that every broker widget prints as gospel. This article is the version of that lesson we wish someone had handed us: what PCR actually measures, why the thresholds you've memorised have no NIFTY derivation behind them, and the narrow, specific way our team still uses the ratio today.

Paper trade every idea in this article before you risk live capital. Nothing below is a signal to buy or sell. It is a description of how one data point behaves, and what it cannot do on its own.
Two ratios wearing one name
"PCR" on your broker dashboard is shorthand for Put-Call Ratio. If the term is new, start with the put-call ratio defined. There are two of them hiding under that single name.
- PCR by Open Interest (OI): total put OI across the chain divided by total call OI. This is what Sensibull's live options chart and most dashboard widgets show by default. It reflects positioning that has survived — contracts traders are still carrying, not contracts they traded and squared off within the hour.
- PCR by traded volume: total put volume divided by total call volume for the session so far. Upstox's F&O discovery page and Dhan's NIFTY 50 options summary both expose this view. It moves fast. It reacts to intraday flow, including flow that unwinds completely by 15:30 and leaves no OI trace at all.
These two numbers can point in opposite directions on the same day. OI-based PCR can sit at 1.1, reading mildly bullish on the old rulebook. Volume-based PCR for the same hour can sit at 0.6, because a wave of call buying got squared off two strikes later and never became open interest. If you quote a PCR number without saying which one, you are not describing the market. You are describing whichever tab your broker's app happened to open on.
In our experience, OI-based PCR is the stickier of the two intraday. It changes meaningfully only when positions are actually built or unwound, not every time a scalper's order hits the book. That stickiness is also its limitation on expiry day, which is the next problem.
Even inside OI-based PCR, the number moves with the settings
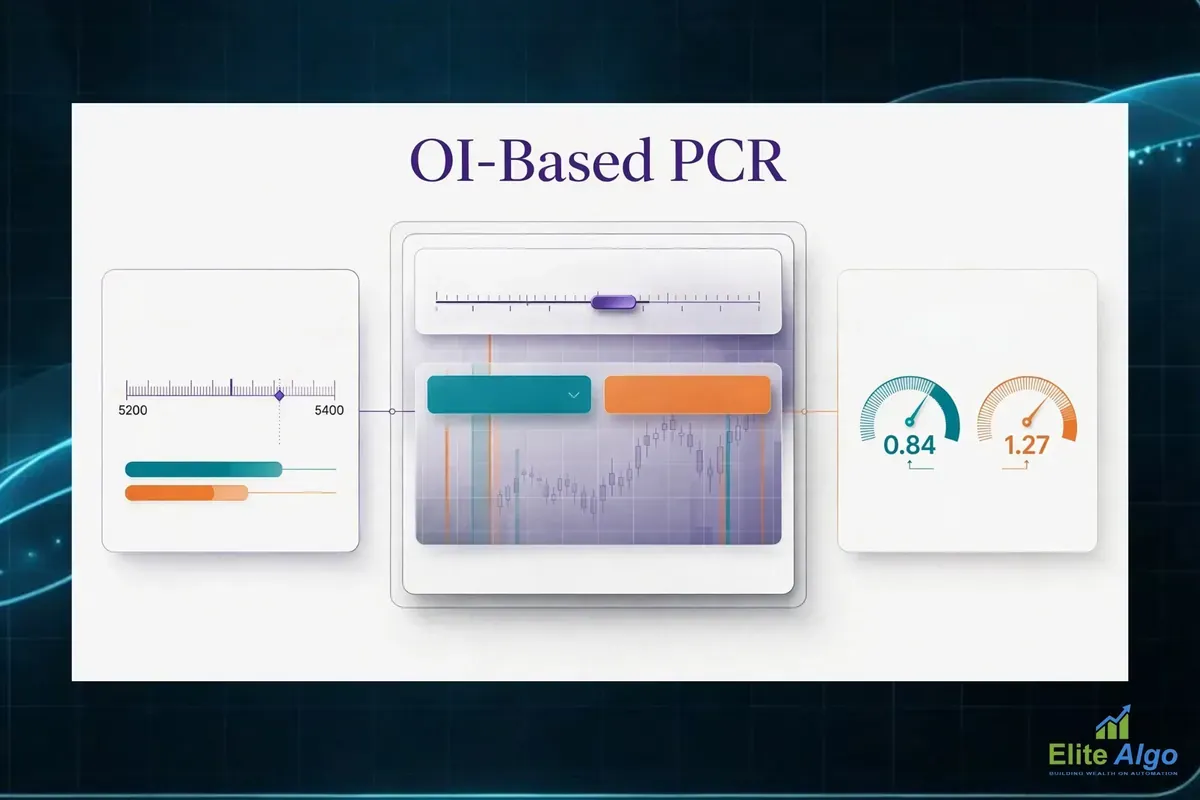
Pick one definition, OI-based, and the numbers still will not match across sites. We saw it while updating this article on 9 November 2026. NiftyTrader's live page showed a NIFTY OI PCR of about 1.09 at 09:19 IST for the nearest expiry. Its own history table, on the same page, had 1.27 at 09:10. Nine minutes, a move of nearly 0.2, while spot slipped about 140 points. IIFL's PCR page, when we opened it, listed 1.27 on OI and 1.17 on volume for the same 9 November expiry. And on 6 November, Stolo's NIFTY page showed 0.60 on OI and 0.31 on volume at the 15:30 close, while TradePulse titled its page for that same date with 1.66.
Those were snapshots taken at different minutes, and we cannot tell you which expiry filter each site used. That is the point. A ratio of two totals that change every minute, quoted with different filters, will not repeat itself on the next screen. Four settings do most of the damage.
- Expiry scope. Nearest expiry only, or every listed expiry added together. Weekly and monthly series carry different OI, and platforms default to different ones.
- Level or change. Change-in-OI PCR divides only the day's new put OI by the day's new call OI. At 09:19 NiftyTrader showed a level of 1.09 next to a change-in-OI figure of 0.41. The stock of positions and the day's new positions were leaning in opposite directions. Both are "PCR".
- Time of day. Early prints are thin. Numbers at 09:15 to 09:30 move a lot on very little, which is why we log ours at 09:30 and not at the bell.
- Whole chain or near-spot strikes. We cover that one in its own section below.
The arithmetic, with real numbers
The formula is plain division: total put OI over total call OI, same expiry, same moment. Zerodha Varsity's chapter on max pain and PCR works one through with NIFTY figures from 10 May 2016: put OI of 3,70,16,925 against call OI of 4,28,74,200. That divides to 0.863. The date is old, the method has not changed.
Two things about this sum are worth knowing before you build anything on it. First, lot size cancels. Both sides are multiplied by the same lot, so the ratio is identical whether you count contracts or units. When someone says NIFTY's lot size changed, so the PCR bands must change, that is not a real reason. (NIFTY's lot is 65 now, as it shows on the live pages. It does not touch the ratio.) Second, every option contract has a buyer and a seller. An OI count tells you how many contracts are open. It does not tell you who started them or why.
Why expiry day breaks the ratio's arithmetic, not just its interpretation
PCR by OI is a fraction. On expiry day, both the numerator and the denominator are being unwound at the same time, just not at the same speed. Near-the-money call writers close out earlier than far OTM put writers. The near strikes are the ones gaining or losing money fastest as spot moves. The result: the same PCR reading of, say, 0.95 can mean "balanced market" at 09:30 and "put side has been abandoned, call side hasn't" at 14:30. That shift has nothing to do with direction. It is purely about which leg unwound first.
NIFTY's weekly contract expires on Tuesday now (it moved from Thursday on 1 September 2025), and SENSEX's on Thursday. The mechanism is the same on both days. Other desks report the same symptom. 5paisa's note on PCR and NIFTY says the ratio swings more near expiry because OI is moving between strikes and hedges are being adjusted, and that these swings often reflect repositioning rather than a lasting view. We would put it more bluntly: the ratio is not turning bullish or bearish through the expiry afternoon. It is turning less meaningful, because open interest is draining out of the chain unevenly as settlement approaches.
We are not quoting a drift figure here, on purpose. Log your own 09:30 and 14:30 prints for a month of expiry sessions and look at the gap. You will believe your own number more than ours, and it will be a number for the expiry filter you actually watch.
This is the single biggest reason the 0.7/1.3 rulebook fails on expiry day specifically. Those bands assume a reasonably stable base of open interest on both sides. Expiry morning gives you that. Expiry afternoon does not.
Where 0.7 and 1.3 actually came from
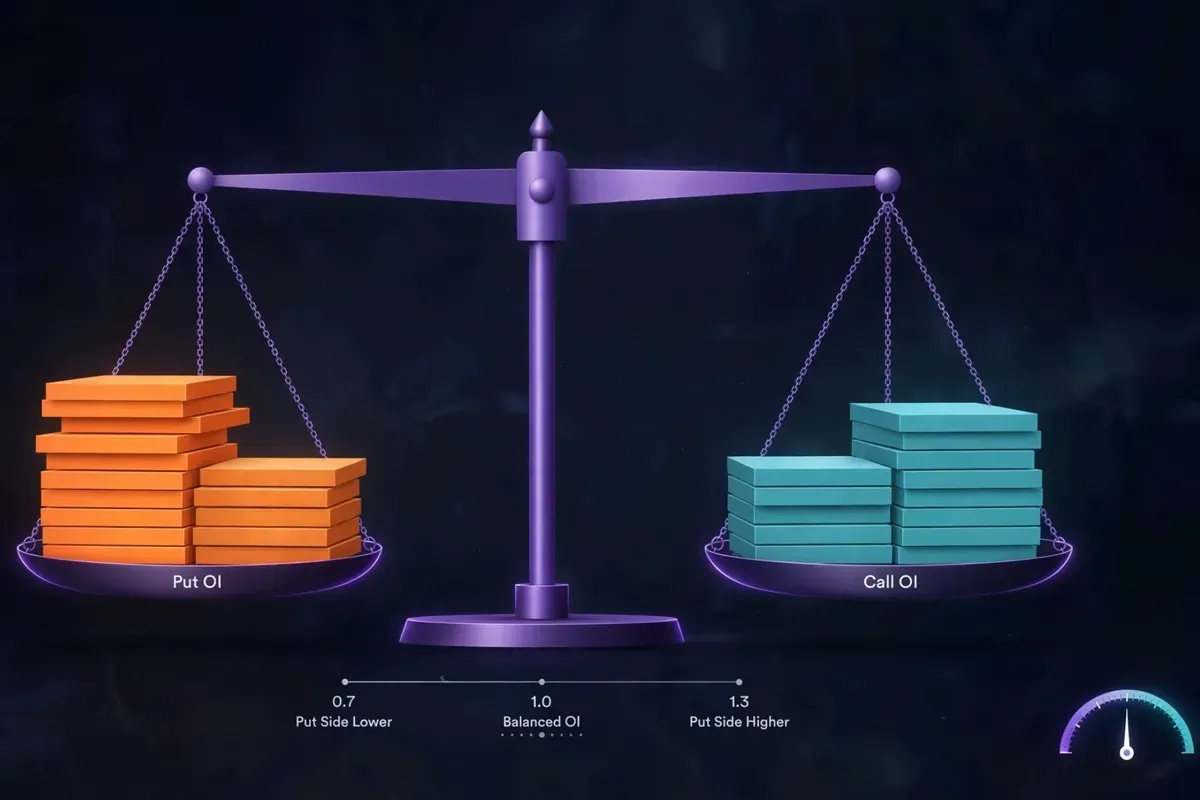
We could not trace them to a NIFTY study, and neither can the guides that quote them. An earlier version of this article said the bands came from US equity-options commentary. We could not source that, so we have taken the claim out. What we can show is how the same numbers get used today, and that is messy enough.
| Source | How it reads about 1.3 | How it reads about 0.7 | What it adds |
|---|---|---|---|
| Zerodha Varsity | Above 1 (example 1.3): too many puts, market oversold, look for an upward reversal | 0.5 and below is overbought. Between 0.5 and 1, ignore it | Calls its thresholds a "generic approach". Plot 1 to 2 years of daily PCR to find each instrument's own extremes |
| IIFL | Above 1 is bearish. In its FAQ, a high PCR "generally" means above 1.0 | A bullish PCR is "generally" below 0.7 | Also says extremes can be read as contrarian, and does not reconcile the two |
| Groww and smallcase | Upper band of NIFTY's usual range. Groww uses 1.4 as a contrarian buying example | About 0.7 is called the average for equity options | Both say NIFTY PCR "usually" oscillates between roughly 0.8 and 1.3 |
| 5paisa | Above 1.3: potentially oversold | Below 0.7: bearish, or overly optimistic | Says there is no fixed ideal |
| Upstox | Above 1.3: strong bearish, and also "oversold zone" | Below 0.7: strong bullish, and also "overbought zone" | One table that is trend-following and contrarian at the same time |
| Equentis | Outside 0.8 to 1.2 needs more analysis | No separate cutoff | Gives no cutoff for "extreme" |
Read down the 1.3 column. The same print is "oversold, look to buy", "strong bearish", "bearish" and "upper edge of normal", depending on which page you happen to land on. The 0.7 looks borrowed from an equity-options average. By the published NIFTY range, a print of 0.7 to 0.8 is already below where NIFTY usually trades, and 1.3 is the top of the usual band, not a rare event. Nobody shows how any of these were derived, and the best guide in the list, Varsity, tells you to derive your own.
That is the fix. It is not a better pair of numbers to memorise. It is building your own distribution for the index you actually trade, and reading the ratio against that. The method is in its own section below.
Contrarian crowding gauge, or trend confirmation — pick one, because the number can't
This is where most explainers quietly contradict themselves. A high PCR gets called "bullish" by the contrarian school: too many people bought puts, the crowd is one-sided, and a short-covering bounce is due. The same high PCR gets called "bearish" by the trend-confirmation school, because heavy put buying signals real hedging demand ahead of a drop. Both readings use the identical number.
Which reading is right depends on where the index sits relative to its recent range, not on the PCR print itself. A PCR of 1.3 after a fresh three-week low, with the index already down sharply, more often reads as capitulation-driven put buying — contrarian bounce territory. The same 1.3 near an all-time high, with spot grinding up slowly, more often reads as genuine hedge demand ahead of a correction — trend-confirmation territory. Treating PCR as a standalone directional signal, divorced from where price already is, asks one input to answer a two-variable question.
IIFL lays the trend-following version out as four readings against NIFTY spot. Rising PCR with rising spot says the trend continues. A very high PCR with spot falling says oversold, possible reversal. PCR rising while spot is flat or down is a bearish divergence. PCR falling while spot holds or rises is a bullish divergence. Varsity's chapter is purely contrarian: when traders are heavily positioned, few are left to push the move further, so the position gets squared off and the index turns. It even calls its own explanation "rather tricky". Both are written in good faith. They disagree about what the same number means.
A rising PCR can mean two opposite things
There is a second problem, and it matters more to a seller than the first. A rising put OI can be traders buying puts, which is a hedge or a bearish bet. It can equally be traders writing puts, which is a bet that the market will not fall below that strike. NiftyTrader's guide calls reading it backwards the common error: put writing is generally bullish, put buying generally bearish, and the ratio alone cannot tell you which one is happening. INDmoney makes the same point, and adds that systematic option-selling can keep PCR skewed without anyone holding a view. We know this from the other side. A desk that writes puts every expiry week adds to put OI every week, and the ratio drifts up with no opinion behind it. So check the change in OI and where the price is going before you decide what a high print means.
What our desk actually does with it: a gate, never a trigger
On our configuration layer, PCR is a context input inside a regime gate. It is one of several conditions that has to agree before a given strategy variant is allowed to fire that session. It is never, by itself, the reason a trade goes on.
We want to be direct about an engineering mistake here rather than skip it. One of our live configs had a PCR-based gate anchored to a fixed threshold that, after an index rebase, almost never crossed. The gate wasn't filtering trades. It was quietly vetoing the strategy on most sessions, and nobody noticed for weeks. A gate that silently never fires is a worse failure than no gate at all. It looks like discipline while actually being a dead switch. We caught it only when we cross-checked how many sessions the strategy had traded against how many days it was scheduled to run — the fire-rate had quietly dropped to under 10% of eligible sessions.
The lesson that survived: re-validate every threshold against current data periodically. Treat a gate's fire-rate as a monitored number, not a fire-and-forget rule. A PCR gate that passes correctly reduces position sizing or strategy selection in low-conviction regimes. Nothing more dramatic than that.
Strike-band PCR beats index-wide PCR
Index-wide PCR sums OI across every listed strike, including deep OTM strikes nowhere near spot. Those far strikes often carry residual hedges that sit there for weeks. They contribute noise rather than signal to today's reading. A narrower calculation changes that. Sum OI only across, say, the ten strikes nearest the current spot price. That strike-band figure tracks the actual positioning that matters for the next few hours of price action far more tightly than the full-chain number.
Our team runs this strike-band version alongside the standard full-chain PCR for exactly that reason. Deep OTM OI on NIFTY weeklies can sit static for days as hedge cover, diluting whatever the near-the-money crowd is actually doing today.
If your broker widget only shows the full-chain figure, you can approximate the band version yourself from the live option chain. Pull the ten-to-twelve strikes around spot and sum OI on each side manually. It takes under two minutes once you've done it a few times, and it tells you considerably more than scrolling to the summary row.
Don't port the thresholds across indices
SENSEX PCR and BANKNIFTY PCR do not behave like NIFTY PCR. That has little to do with sentiment and a lot to do with who trades each chain and how deep it is. Lot size is not the reason, since it cancels in the ratio. NIFTY's weekly contract carries the deepest liquidity of any Indian index option, and its OI base is large and relatively stable intraday. SENSEX options have a comparatively thinner OI base outside expiry week, so a modest amount of trading can move the ratio by far more than the same trading would move NIFTY's. Single stocks are worse still. One large trade can distort a stock's PCR, which is why NiftyTrader and Ventura both call the ratio more dependable on liquid index options.
BANKNIFTY is its own case. NSE stopped its weekly options in November 2024 (we explain the rule in BankNifty lost its weekly expiry), so its options now run on a monthly cycle only. A PCR band you worked out in the weekly era was measured on a different pool of open interest. It tells you very little about today's monthly chain. The same applies to the expiry itself: NIFTY weekly is Tuesday, SENSEX weekly is Thursday (see our SENSEX weekly expiry note), and a PCR you read on one is not a reading of the other.
Treat each index's PCR as its own instrument with its own normal range. A SENSEX PCR of 1.2 is not automatically the same signal as a NIFTY PCR of 1.2, even measured at the same moment on the same morning.
A method you can actually run yourself
Here is the version of this we would recommend building, in place of memorising someone else's bands.
- Every trading day, log the strike-band PCR at a fixed time. We use the 09:30 snapshot, after the opening fifteen minutes of noise settles.
- Log the index's realised move for the remainder of that session: closing level versus the 09:30 level.
- Write down which PCR you are logging: OI or volume, nearest expiry or all expiries, whole chain or strike band. Never change it midway. If you change it, restart the log.
- After roughly three months, about 60 trading sessions, you have your own distribution for your own index, not a borrowed one. Treat it as provisional. Varsity suggests one to two years of daily readings, and more history makes the tails more trustworthy.
- Only act when today's PCR sits in the outer tails of YOUR distribution, not against a generic 0.7/1.3 line that was never built for this market.
The mistakes we see most are short. Reading the ratio with no price context. Reading it without knowing whether it is OI or volume. Comparing a number from one site with a number from another. Trusting a 09:15 print. And trusting a single reading when the trend over the last hour is what matters; NiftyTrader suggests watching 15, 30 and 60 minute windows and waiting 15 to 30 minutes when the ratio is moving fast. Avoid those and you are already ahead of most dashboard users.
This single change, distribution-against-yourself instead of threshold-against-folklore, is the difference between PCR as decoration on a dashboard and PCR as one small, honest input into a process. We built our own backtesting engine in-house specifically because research like this needs real tick-level option-chain history, not a screenshot of a single day's chain.

A worked example: why the band figure and the full-chain figure disagree
These numbers are illustrative, to show the mechanics. They are not a live capture. Take a NIFTY weekly snapshot with the index at 24,850. Sum OI across the eleven strikes from 24,600 to 25,100. That band might show roughly 38 lakh units of put OI against 31 lakh units of call OI — a strike-band PCR of about 1.23. Now pull the index-wide figure for the same moment, across all 60-plus listed strikes including far OTM hedges. That number might read closer to 0.95, because a large static put hedge sitting at the 23,000 strike skews the full-chain denominator.
Two "correct" PCR numbers, from the same chain, at the same second, disagreeing by nearly 30%. Neither is wrong. They are answering different questions. Only the strike-band figure is telling you anything about the next few hours near spot.
Reading PCR alongside implied volatility, not instead of it
PCR tells you about positioning. It says nothing on its own about how much the market expects to move. We pair the strike-band PCR reading with the day's ATM implied volatility before either number gets weight in a configuration decision. A PCR print sitting in the tail of its distribution, on a day where ATM IV is also elevated versus its own recent average, carries more information than the same PCR print on a dead, low-IV session where options are barely moving. Reading the two together, instead of PCR alone, has cut a meaningful share of the false reads our earlier, PCR-only version of the gate used to produce in our own testing.
This matters most on expiry day itself, when IV crush through the session can make a stable-looking PCR number sit next to a rapidly collapsing volatility premium. A trader watching only the ratio would see nothing unusual. A trader watching the ratio against IV would see the actual regime shift happening underneath it.
India VIX is the fastest second opinion you can get for free. NiftyTrader's guide has a simple matrix we agree with: a high PCR with a high VIX means fear is real and you watch whether support holds, while a high PCR with a low VIX is more likely plain hedging and a weaker signal. A low PCR with a low VIX is complacency, not strength. We cover how VIX should size what you sell in India VIX and your short strangle's premium budget, and how the premium itself decays hour by hour in the NIFTY expiry-day premium clock.
Max pain gets quoted next to PCR in almost every guide, Varsity's included, so people treat the two as a pair. They are built from the same open interest but they say different things: one is a ratio, the other a strike. We tested the pin in Max Pain on NIFTY: Testing the Pin Everyone Quotes. Read it before you let a PCR print near max pain talk you into a trade.
What a documented gate configuration looks like in practice
Concretely, the PCR condition inside one of our configs looks roughly like this: strike-band PCR must sit outside the 25th-to-75th percentile of its own trailing 60-session distribution, AND ATM IV must sit above its own 20-session median, before the gate passes. Both conditions failing, or only one passing, holds the strategy at reduced size rather than blocking it outright — we size down on ambiguous regime reads rather than switching a strategy fully on or off, which is a gentler failure mode than a hard veto. Every quarter we re-run the trailing distribution check across the most recent sessions and compare it against the distribution the gate was built on, specifically to catch the kind of silent drift that caused the earlier mis-anchored threshold.
None of this is a signal anyone should copy wholesale into a live account. It is one working desk's process, documented honestly, including the part where it broke.
Where to see live NIFTY PCR, and what each page actually shows
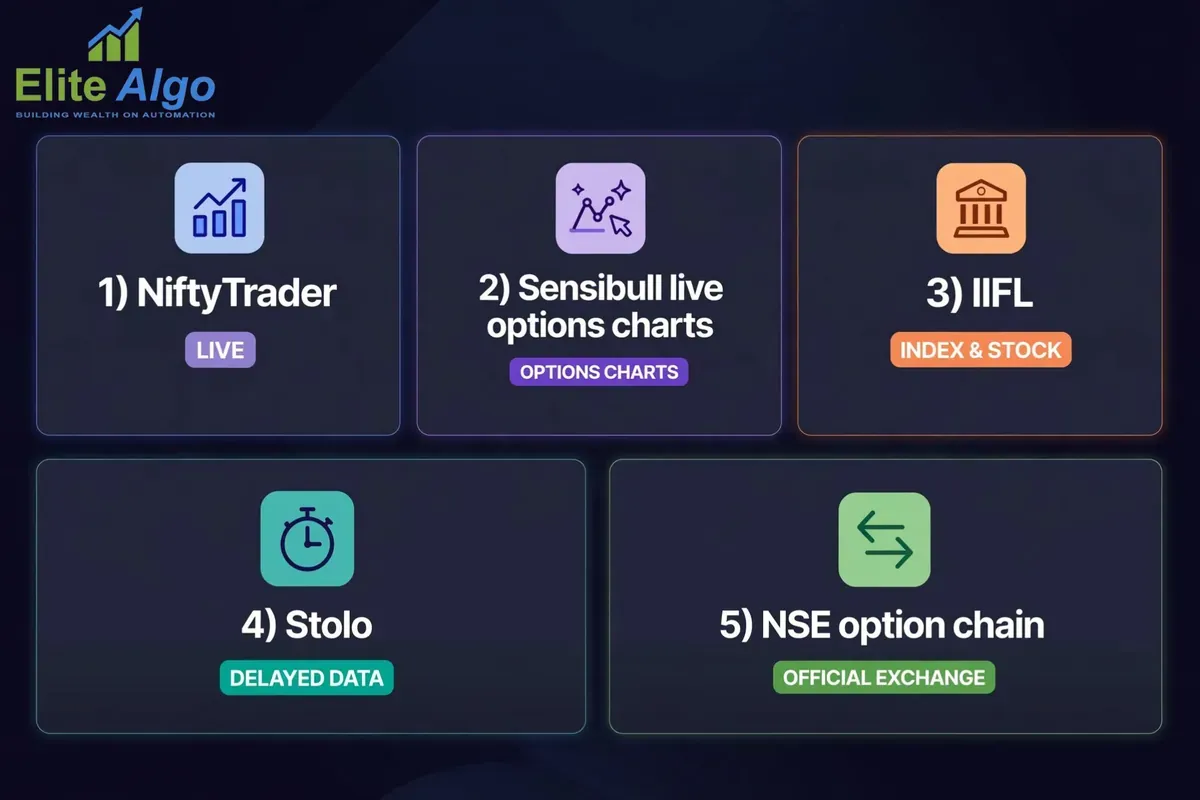
You do not need to pay for this. Most of the live views are free, but each one has its own defaults, so check the settings before you quote a number.
| Page | What it shows | What to check |
|---|---|---|
| NiftyTrader | OI PCR, change-in-OI PCR, volume PCR, max pain, and a 30-minute history table. Says it refreshes every minute in market hours | Nearest expiry is the default. Use the expiry selector |
| Sensibull live options charts | OI, IV, PCR, IV percentile and max pain charts on one screen | Pairing PCR with IV is the useful part |
| IIFL | Index and stock PCR, on both OI and volume, by expiry | Stock tables use a different expiry from the index table |
| Stolo | OI PCR and volume PCR side by side with total call and put OI | Data is delayed about 15 minutes, per the page |
| NSE option chain | Open interest by strike for calls and puts, from the exchange itself | Total each side and divide, and you have your own PCR with no unknowns in it |
None of these tells you whether today's print is unusual for NIFTY. That part you still have to do yourself, and the method above is how.
Sources and a closing note
Paper trade first. None of the above replaces position sizing, stop discipline, or testing a rule on your own data before it touches live capital. A single ratio cannot carry a trading decision on its own. EliteAlgo publishes this kind of research because option sellers deserve to know what a dashboard number is measuring before they build a rule around it. If you want to see how we test ideas like this before they reach a live configuration, our algo trading strategies page walks through the broader framework. Our NIFTY option-selling primer for beginners is the right place to start if strike-band OI is new to you. Traders running both indices should see how we handle NIFTY and SENSEX algo trading differently. To test your own version of the distribution method, read options backtesting software built for the Indian market and how to backtest an option selling strategy. For the strike-level side of OI, see option chain analysis for sellers and NIFTY OI data without the folklore.
Published figures quoted above come from the pages linked in the text: Zerodha Varsity, IIFL, Groww, smallcase, 5paisa, Upstox, Equentis, NiftyTrader, INDmoney and Stolo. Live snapshots were taken on 6 and 9 November 2026 and will have moved. Thresholds on those pages are conventions, not exchange rules. EliteAlgo is a proprietary research desk and publishes analytical software and research, not investment advice. Nothing above is a recommendation, and no return outcome is implied or guaranteed.
Frequently Asked Questions
What is a good PCR for NIFTY?
There is no universal "good" number. That is the core problem with the 0.7/1.3 rulebook. Published guides put NIFTY's usual PCR range at roughly 0.8 to 1.3 (Groww and smallcase), or 0.8 to 1.2 (Equentis). A reading well outside that range deserves a closer look, and the better test is how today compares with your own log of the index. The same reading could be entirely normal for SENSEX or BANKNIFTY.
Is high PCR bullish or bearish?
It depends on where price already is, not on the number alone. High PCR after a sharp decline often reads contrarian-bullish — crowded put positioning due for an unwind. High PCR during a slow grind higher more often reads as genuine bearish hedge demand. Treat PCR as a modifier on price context. Never use it as a standalone directional call.
What's the difference between PCR by OI and PCR by volume?
PCR by open interest reflects positions still held on the books. PCR by traded volume reflects today's trading flow, including trades opened and closed within the same session that leave no OI behind. Most broker dashboard widgets default to the OI version. Check which one you are reading before comparing it to anyone else's number.
Does PCR work on expiry day?
Less reliably than on a non-expiry session, and specifically in the afternoon. As both call and put OI unwind unevenly through expiry day, the ratio can shift meaningfully with no corresponding shift in market direction. Weight an expiry-afternoon PCR reading lower than a morning one.
Where can I see live NIFTY PCR?
Upstox's F&O discovery page, Sensibull's live options chart, Groww's options tools, and Angel One's knowledge center all publish a live NIFTY PCR figure. Each typically shows the OI-based version by default. Cross-check which definition is displayed, since the same label can mean different things across platforms.
Is PCR different for SENSEX and BANKNIFTY?
Yes. Strike spacing, the depth of open interest and who trades each chain differ enough between NIFTY, SENSEX and BANKNIFTY that the same PCR number does not carry the same meaning across indices. BANKNIFTY also runs on a monthly cycle only since November 2024. Build a separate normal range for each index you trade rather than reusing one threshold everywhere.
How often should I recheck a PCR-based rule?
Periodically and deliberately, not once and forgotten. Our own experience with a silently mis-anchored gate is the case study. A threshold that was correct when it was set can quietly stop firing after an index rebase or a volatility regime change. Review the fire-rate of any PCR-based rule every few months, not just its win rate.
How do I calculate NIFTY PCR myself?
Add up the total put open interest and the total call open interest for one expiry from the NSE option chain, then divide put by call. Zerodha Varsity's worked example is 3,70,16,925 puts over 4,28,74,200 calls, which is 0.863. Lot size does not matter, because it multiplies both sides equally and cancels.
What does a PCR of 1.6 mean for NIFTY?
It means about 1.6 put contracts are open for every call contract. That is above the usual published NIFTY range of roughly 0.8 to 1.3. The ratio cannot say whether the puts were bought as hedges or written as support, so check the change in OI and the price trend before reading it as bearish or as a contrarian bounce.
What does a PCR of 0.9 mean?
A little more call OI than put OI. That sits inside NIFTY's usual range and inside what most guides call balanced (0.7 to 1.0). On its own it says close to nothing. The direction it is moving in, and what the price is doing, say more.
Does lot size change the PCR?
No. Calls and puts on the same index use the same lot, so the multiplier cancels when you divide. A lot-size revision changes your margin and position size, not the ratio.
Why does my app show a different NIFTY PCR from another site?
Usually one of four things: OI against volume, nearest expiry against all expiries, level against change in OI, or the snapshot time. On 6 and 9 November 2026 we saw readings from 0.60 to 1.66 across public pages. Check the settings on both before you decide which one is wrong.
Where do I check PCR on NSE?
The NSE option chain gives open interest by strike for calls and puts. Total each side and divide. Free live views with the ratio already worked out include NiftyTrader, Sensibull's live options charts and Upstox's OI analysis page.
Should I combine PCR with implied volatility?
Yes — on its own, PCR tells you about positioning, not about expected movement. Reading a tail-end PCR print alongside elevated ATM IV gives a materially stronger signal than either number checked in isolation, particularly on expiry day when IV crush can mask what positioning is actually doing.