Written by Rajeev Gupta, founder of EliteAlgo. Our desk trades NIFTY and SENSEX expiry-day option selling and runs its own backtest engine. Last reviewed November 9, 2026.
Quick Answer
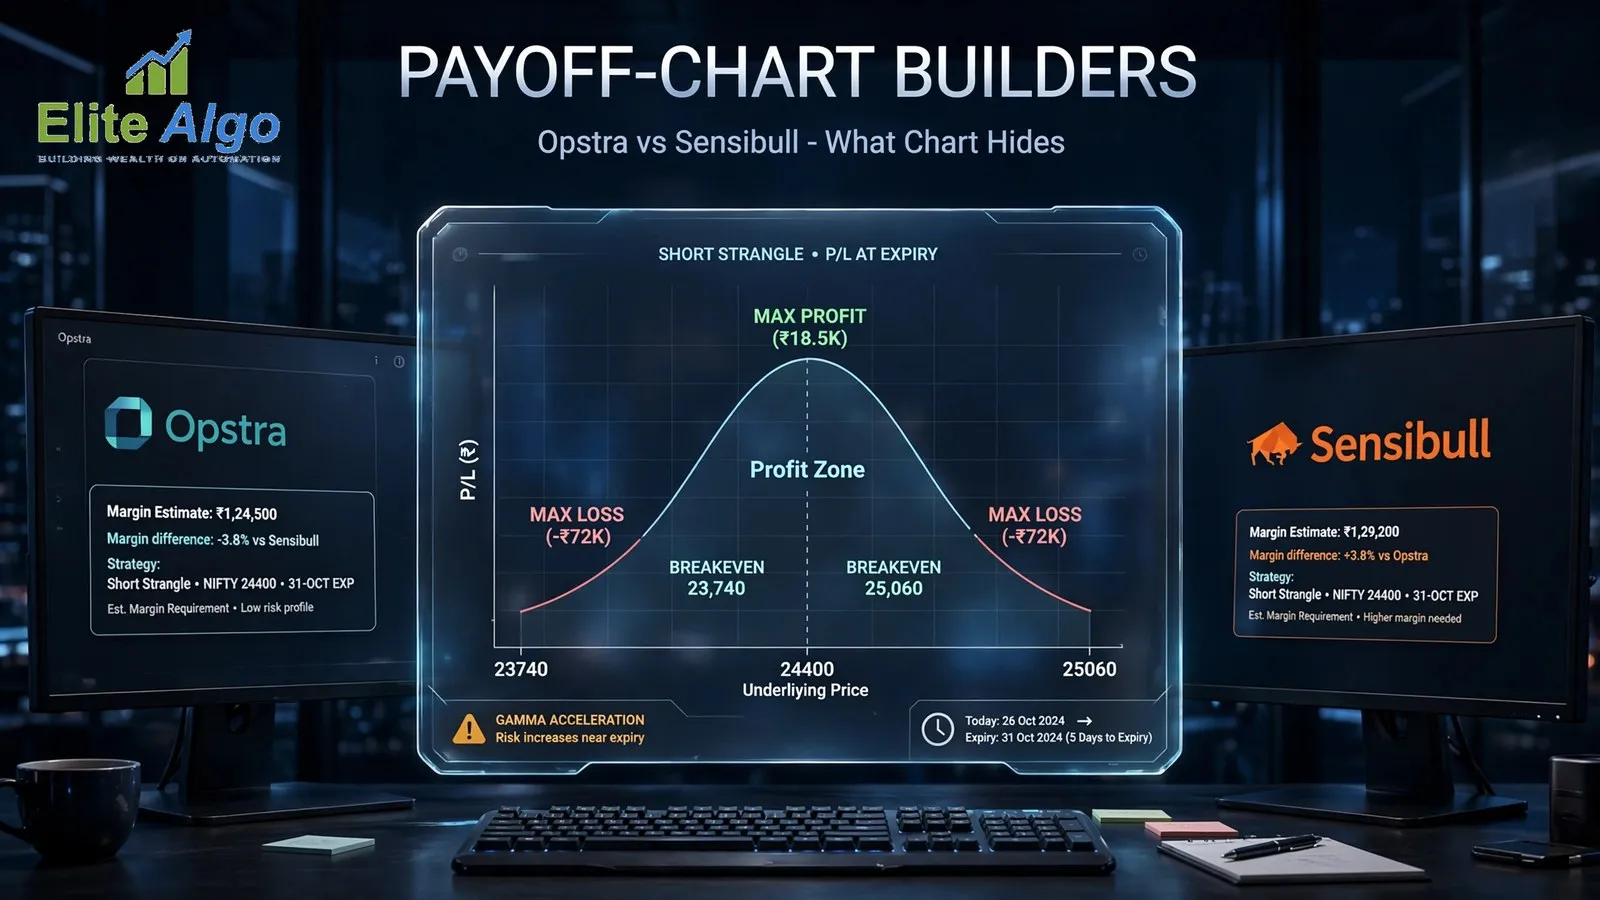
Opstra and Sensibull both draw the same two things for a position you build. The first is the expiry line, which is your profit or loss if you hold every leg to settlement. The second is a target-date line, which is the estimated profit or loss on a day you pick before expiry, using the option prices that day would give. Sensibull's own blog says its payoff table shows the strategy's P&L "on Target Day and Expiry Day", and a target date slider moves the day. Traders on Zerodha's Trading Q&A describe the blue line on an Opstra chart the same way: expected profit or loss for the day, moved by spot, implied volatility and days left.
The mistake that costs sellers money is reading the expiry line as if it were today's P&L. For a short strangle the expiry line is the kind one. Until the last day, the target-date line sits below it almost everywhere. The sold options still carry time value, so closing them costs more than their expiry value. The worked example below puts numbers on it.

On price: Opstra has a free Basic tier, but its data is delayed 15 minutes (per a competitor's comparison page, so check it). Sensibull's strategy builder is part of its paid Pro plan, except for Zerodha users who get Sensibull free. Exact rupee prices are in the pricing section further down, with the source and date of each one.
Paper trade this first. Everything here is for education and analysis. EliteAlgo is proprietary trading research and analytical software, not investment advice. Test any structure on a paper account before it touches live capital.
What a Payoff Chart Actually Draws
Add a short strangle in either builder and you get a chart with spot on the x-axis and profit or loss on the y-axis. Three things sit on it.
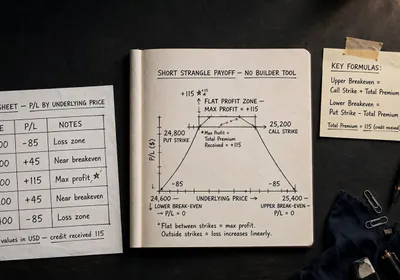
- The expiry line. A flat-topped tent for a short strangle. The flat top is your full credit. The two slopes are the losses once spot is beyond a sold strike by more than that credit. Max profit, max loss and both breakevens are read from this line.
- The target-date line. A smooth curve. It prices each leg with a model for the day you choose, so it responds to the time left and to implied volatility (IV). Move the target date towards expiry and it bends into the expiry tent.
- The table or readout behind it. Sensibull has a payoff table with a "Show %" toggle that shows P&L at percentage moves from the current price. Both tools show Greeks for the combined position.
So the older advice you will see in many guides, that a builder shows only expiry P&L, is out of date. Both tools can show you today's estimate. The risk is that you open the tool, glance at the tent, and never touch the target date.
Two more limits come from how these lines are built. Opstra's blue line, according to the Trading Q&A thread, "does not include charges". And a model line is only as good as its inputs. A user on the same forum complained in 2020 that the Sensibull graph used stale data while the underlying's last price kept updating, and Sensibull replied that it planned to raise the refresh rate. Treat any target-date number as an estimate, not a fill price.
Worked Example: Why the Expiry Line Flatters a Short Strangle
This is a model run, not a trade from our book. We priced a short strangle with the Black-Scholes formula so the numbers can be checked by anyone. Assumptions: NIFTY at 25,000 (a round number, not today's level), 7 days to expiry, IV 14% on both legs, interest rate 6.5%, short the 24,600 put and the 25,400 call. The credit is about 112 points, and the breakevens at expiry are about 24,488 and 25,512. A lot is 65 units, so 112 points is about Rs 7,289 per lot before costs.
Now move three days forward, so four days are left, and ask what the position is worth at a few spot levels.
Model only: short NIFTY 24,600 put and 25,400 call, credit about 112 points, IV 14%, 4 days left. The dashed line is below the solid line at every spot level shown.
| NIFTY | Expiry line (points) | 4 days left, IV 14% | 4 days left, IV 17% | 4 days left, IV 17%, per lot |
|---|---|---|---|---|
| 25,000 | +112 | +61 | +22 | +Rs 1,453 |
| 25,300 | +112 | -2 | -40 | -Rs 2,580 |
| 25,450 | +62 | -74 | -109 | -Rs 7,066 |
| 25,600 | -88 | -171 | -200 | -Rs 13,009 |
Read the row for 25,300. The expiry chart says you are at full profit, 112 points, sitting comfortably inside the flat top. With four days left the same position is worth about break-even, because the 25,400 call you sold still has real premium on it. If IV has also risen three points, it is a loss of about Rs 2,580 per lot. Nothing is wrong with the chart. It tells you what you collect if spot stays here until settlement. It does not tell you what you can book today.
The row for 25,600 is the one beginners get backwards. At expiry the loss would be 88 points. With four days left it is 171 points, almost double, because the call you sold is worth its intrinsic value plus time value. The idea that a position deep in the loss zone is "cushioned" by remaining time value is wrong for a seller. Time value is on the other side of the trade from you. It is a cost to buy back, and it only works for you as it decays.
That is also why the target-date line matters most in the first few days of a weekly cycle. On expiry morning the two lines nearly meet. For how fast they close up through the session, see our note on how option premium moves through an expiry day, and for the Greeks behind it, option Greeks on expiry day.
Opstra vs Sensibull for an Option Seller
We have not benchmarked the two tools against a broker, and we are not going to quote margin accuracy or leg limits we did not measure. What can be said, with sources, is below.
| Question | Opstra | Sensibull |
|---|---|---|
| Who runs it | Definedge Securities | Sensibull, integrated with several brokers. Zerodha users get it free |
| Free tier | Yes, a Basic tier. A comparison page reports data refreshed every 15 minutes on it | Yes, but the free plan does not include the strategy builder (Sensibull's help article lists the builder under Pro) |
| Payoff chart with target date | Yes. Users describe a blue line for the day alongside the expiry line | Yes. Target date slider and a payoff table for target day and expiry |
| Backtesting on past option data | Yes. Opstra lists a backtester and a simulator. Definedge also sells a separate backtester, Optest | No. Sensibull's help centre says it has no historical backtester. It has virtual trading, which looks forward from today |
| Sending the orders | Definedge has promoted trading directly from Opstra, through its own broking arm | Through linked brokers such as Zerodha, Angel One, Upstox and ICICI Direct |
| Best at | Depth: IV, OI and historical chain tools | Speed: build a structure and send it as a basket |
Our read, for what it is worth. If you only want to draw a strangle, check the breakevens and place it, Sensibull is quicker, and it is free if your broker is Zerodha. If you want to look at how a structure behaved on past expiries before you place it, Opstra can do that and Sensibull cannot. For rule-based testing of an expiry-day sell at a fixed time with a fixed stop, neither is the right tool. That is what a backtesting platform is for, and we list the options in our comparison of options backtesting software and in our Sensibull alternatives for option sellers.
Is Opstra Free? Is Sensibull Free?

Opstra. There is a free Basic tier. OIData's comparison page, dated October 23, 2026, reports Opstra's paid list as Rs 1,300 plus GST for a month, Rs 6,000 plus GST for six months and Rs 11,000 plus GST for a year, and says Basic data refreshes every 15 minutes. That is a competitor's page and Opstra's own pricing page needs a login to render, so confirm on the site. One thing does line up: Definedge's own Optest page lists an Opstra plus Optest bundle at Rs 7,999 plus GST against a listed Rs 11,000.
Sensibull. Sensibull's help article (last modified July 23, 2026) says it is "100% free for Zerodha users". On other brokers there is a Free plan and a Pro plan. Free covers the basic option chain, verified P&L, a watchlist, the positions page, FII/DII data and expiry trades. Pro adds the strategy builder, draft portfolios, the screener, multi-strike open interest, the IV chart and the multi straddle-strangle charts. The article does not print the rupee price. Two reviews from October 2026 quote Pro at Rs 1,300 a month, often discounted to about Rs 800, with an annual offer that works out near Rs 392 a month. Older broker help pages quote Rs 800 plus GST. Check the Sensibull plans tab before paying.
For a two-leg or four-leg index structure, either free route is enough to draw the chart. The practical difference is the data. A 15-minute delay on live prices is fine for planning a trade tomorrow and not fine for adjusting one today.
How to Use Either Builder for a Short Strangle
- Pick the underlying and the expiry you will actually trade. Weekly and monthly cycles have very different time value.
- Add both legs as a sell. Check the premium shown against the live option chain. A stale price makes every other number wrong.
- Read the expiry line first. Note max profit, both breakevens and the loss per point beyond them.
- Then move the target date. Set it to tomorrow, then to the day before expiry. Watch how far the curve sits from the tent at the spots you care about.
- Shift IV by a few points. A short strangle is short vega, so a rise in IV hurts before spot does anything. Our India VIX premium budget note shows how to size this.
- Check margin in your broker's ticket. The builder gives a planning figure only. See why in SPAN and exposure margin on a NIFTY strangle and NSE margin calculator vs broker margin.
- Rebuild after any adjustment. The moment you roll a strike or close a leg, the old chart describes a position you no longer hold.
What No Payoff Chart Shows You
- Costs. Brokerage, STT, exchange charges, GST and slippage are not in the line. On a one-lot weekly strangle they can eat a visible share of a 100-point credit.
- Flat IV across the move. The model holds one IV per leg. Real markets reprice the put side and the call side differently when spot moves fast, which is skew.
- Exit price. Closing four legs means crossing the bid-ask spread four times. On an illiquid strike that is a real fraction of the premium.
- Intraday margin changes. Margin is quoted at the moment you build. It can change through a volatile session, so check with your broker.
- Gamma into expiry. The tent is a picture of the destination. It hides how fast delta changes in the last sessions.
- A track record. A payoff line shows what a structure pays at each spot. It does not say how often spot lands there. That needs historical testing, which is the job of a backtest, covered in simulator vs backtest.
Four Ways Sellers Misread the Target-Date Line
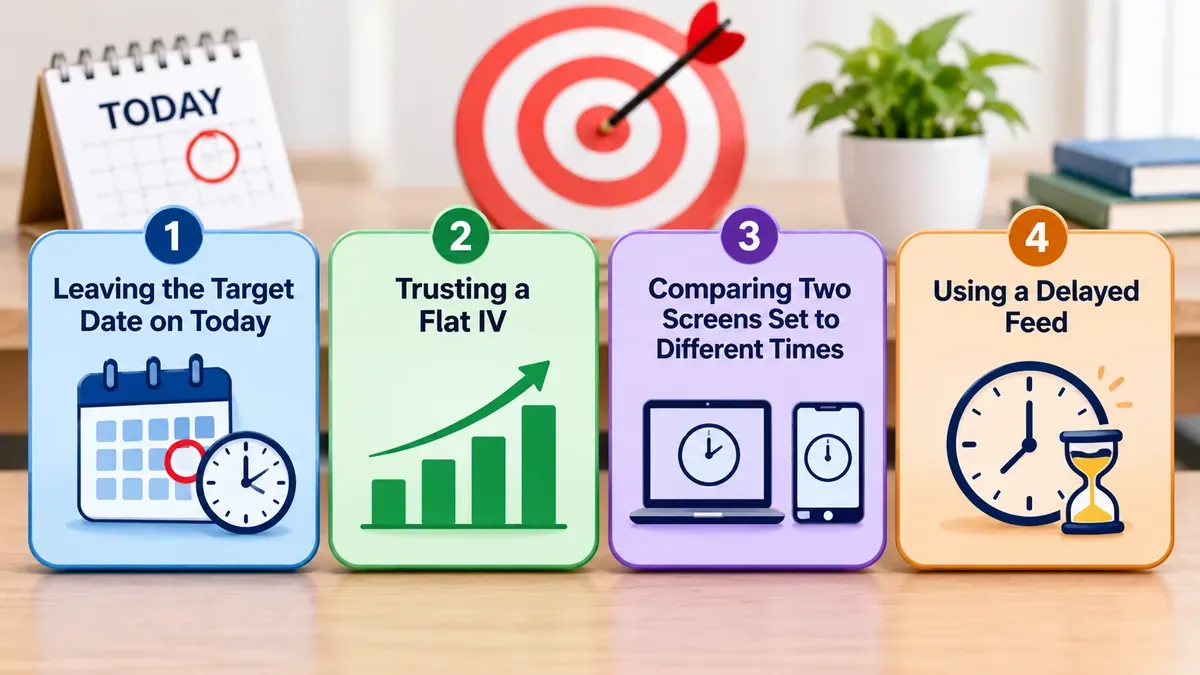
Once you know the line exists, there are still easy ways to get it wrong.
- Leaving the target date on today. A target date of "now" shows almost no time decay at all. The line looks close to flat, and you think the position is safe. Move the date forward and the picture changes.
- Trusting a flat IV. The line assumes the IV you entered, or the IV on the option chain at that moment. A short strangle is short vega, so a three-point rise in IV can cost more than a 100-point move in spot. Always run the line once with IV up.
- Comparing two screens set to different times. If the web chart and the app chart disagree, check that both target dates and times match before you suspect a bug. A different target time gives a different curve.
- Using a delayed feed. A line drawn from prices that are 15 minutes old on a fast day is a picture of the past. This applies to any free tier with delayed data, not only Opstra's, so check the refresh time on whichever tool you use.
Which One Should a Beginner Start With?
If your broker is Zerodha, start with Sensibull because it costs nothing extra and the builder is easy to read. If you plan to study how structures behaved on past expiries, add Opstra's free tier for the historical tools, and accept the delayed data. If you are not on Zerodha and only need the payoff check once or twice a week, the hand-drawn method in our payoff diagram guide costs nothing and teaches you more than the tool does. Whichever you use, take the first month on a paper account, as covered in paper trading option selling.
Other Ways to Draw the Same Chart
You do not need either of these two tools to get the numbers. A short strangle's payoff is simple arithmetic, and we show how to draw it by hand and in a spreadsheet in how to read an option payoff diagram without a builder tool. AlgoTest, a rival backtesting platform, advertises a one-week unrestricted trial of its strategy builder on its own blog (June 2026, vendor claim). TradingView also has an options strategy builder with what-if scenarios. For a paper account to follow a structure through the week without risk, see paper trading option selling.
Where This Fits
A builder answers one question well: what does this exact structure pay at expiry, and roughly what is it worth on another day. It does not manage the position, enforce an exit or tell you whether the idea has worked before. If you are choosing tools for the whole job, from payoff planning to execution, see what to look for in an algo trading platform built for option sellers. For the ATM straddle premium charts that Sensibull offers as a separate feature, see how to read a straddle chart, and for the structure itself, the short strangle explained.
Sources Checked for This Update
Sensibull help article on plans (modified July 23, 2026); Sensibull blog post on the payoff table (July 6, 2023); Zerodha Z-Connect post on Multi Straddle-Strangle Charts (October 1, 2026); Zerodha Trading Q&A threads on Sensibull's target-date line (2020, 2024) and on the Opstra chart; OIData comparison page (October 23, 2026); Strike Money and AlgoTest Sensibull reviews (2026); Definedge Optest pricing page (October 2026). Prices from third-party pages are marked as such because both vendors render their own price pages in the browser only.

Frequently Asked Questions
Is Opstra free?
Yes, in part. Opstra has a free Basic tier, and a comparison page dated October 23, 2026 reports that Basic data refreshes every 15 minutes. The same page lists the paid plans at Rs 1,300 plus GST for a month, Rs 6,000 plus GST for six months and Rs 11,000 plus GST for a year. That page belongs to a competitor and Opstra's own price page only renders in a browser, so confirm on the Opstra site before you pay.
Is Sensibull free?
It is free for Zerodha users. On other brokers there is a Free plan and a paid Pro plan. Sensibull's help article, last modified July 23, 2026, puts the strategy builder, draft portfolios, screener, multi-strike open interest and IV chart under Pro. The article does not print the rupee price. Two 2026 reviews quote Pro at Rs 1,300 a month, often discounted to about Rs 800.
Opstra vs Sensibull for option strategies, which is better?
It depends on the job. Sensibull is quicker for building a structure, checking the payoff and sending the orders through a linked broker, and it is free for Zerodha users. Opstra goes further on volatility and open interest tools and has a historical backtester and simulator, which Sensibull does not. For a rule-based expiry-day backtest with fixed entry and exit times, neither is the right tool.
Does the payoff chart show today's P&L or expiry P&L?
Both, if you use it right. The solid expiry line shows profit or loss if every leg is held to settlement. Both Sensibull and Opstra also draw a target-date line, which estimates profit or loss on a day you choose. Sensibull's payoff table shows P&L on the target day and on expiry. If you never move the target date, you are only reading the expiry line.
Why does my chart show a profit but my position is showing a loss?
Because the expiry line and today's value are different things. In our Black-Scholes example, a short strangle with four days left and NIFTY at 25,300 shows +112 points on the expiry line and about break-even today. The sold options still carry time value, and it only decays in your favour as expiry gets closer. If implied volatility has risen as well, today's number can be well below the expiry line.
Can Sensibull or Opstra backtest an options strategy?
Opstra lists a backtester and simulator, and Definedge sells a separate backtesting product, Optest. Sensibull's help centre says it has no historical backtester. Its virtual trading looks forward from today. A payoff chart shows what a structure pays at each spot level. It does not show how often spot ended there, which needs historical testing.
Do these tools show intraday margin changes?
Treat their margin figure as a planning estimate taken when you build the structure. Your broker blocks the real margin, and under SEBI's peak margin rules it can change through the session. Always confirm in your broker's order ticket before you place the trade.
Should I rebuild the payoff chart after adjusting a position?
Yes. The moment you roll a strike, add a wing or close a leg, the chart you originally built no longer describes your position. Rebuild it with the adjusted legs, then read both the expiry line and the target-date line again.
What is the best free option strategy builder in India?
For drawing a payoff chart, Opstra's free Basic tier works if you can live with delayed data, and Sensibull is free for Zerodha users. A hand-built spreadsheet also works for a simple strangle. Whichever you use, read the target-date line as well as the expiry line.
This article is for educational and informational purposes only and does not constitute investment advice. EliteAlgo is proprietary trading research and analytical software; it is not a SEBI-registered investment adviser and does not provide investment advice or trading tips. Options trading, including strangles, straddles and multi-leg structures, involves substantial risk of loss and is not suitable for all investors. Paper trade any structure discussed here before deploying live capital, and consult a SEBI-registered investment advisor and review NSE and SEBI guidelines before trading derivatives.